Your Data, In a Format You Can Actually Use
Revolink's dashboard is built for day-to-day link management. But the moment you need to send a report to a client, run a revenue analysis in a spreadsheet, archive campaign data before cleanup, or pull numbers into your BI tool - you need the data outside the dashboard.
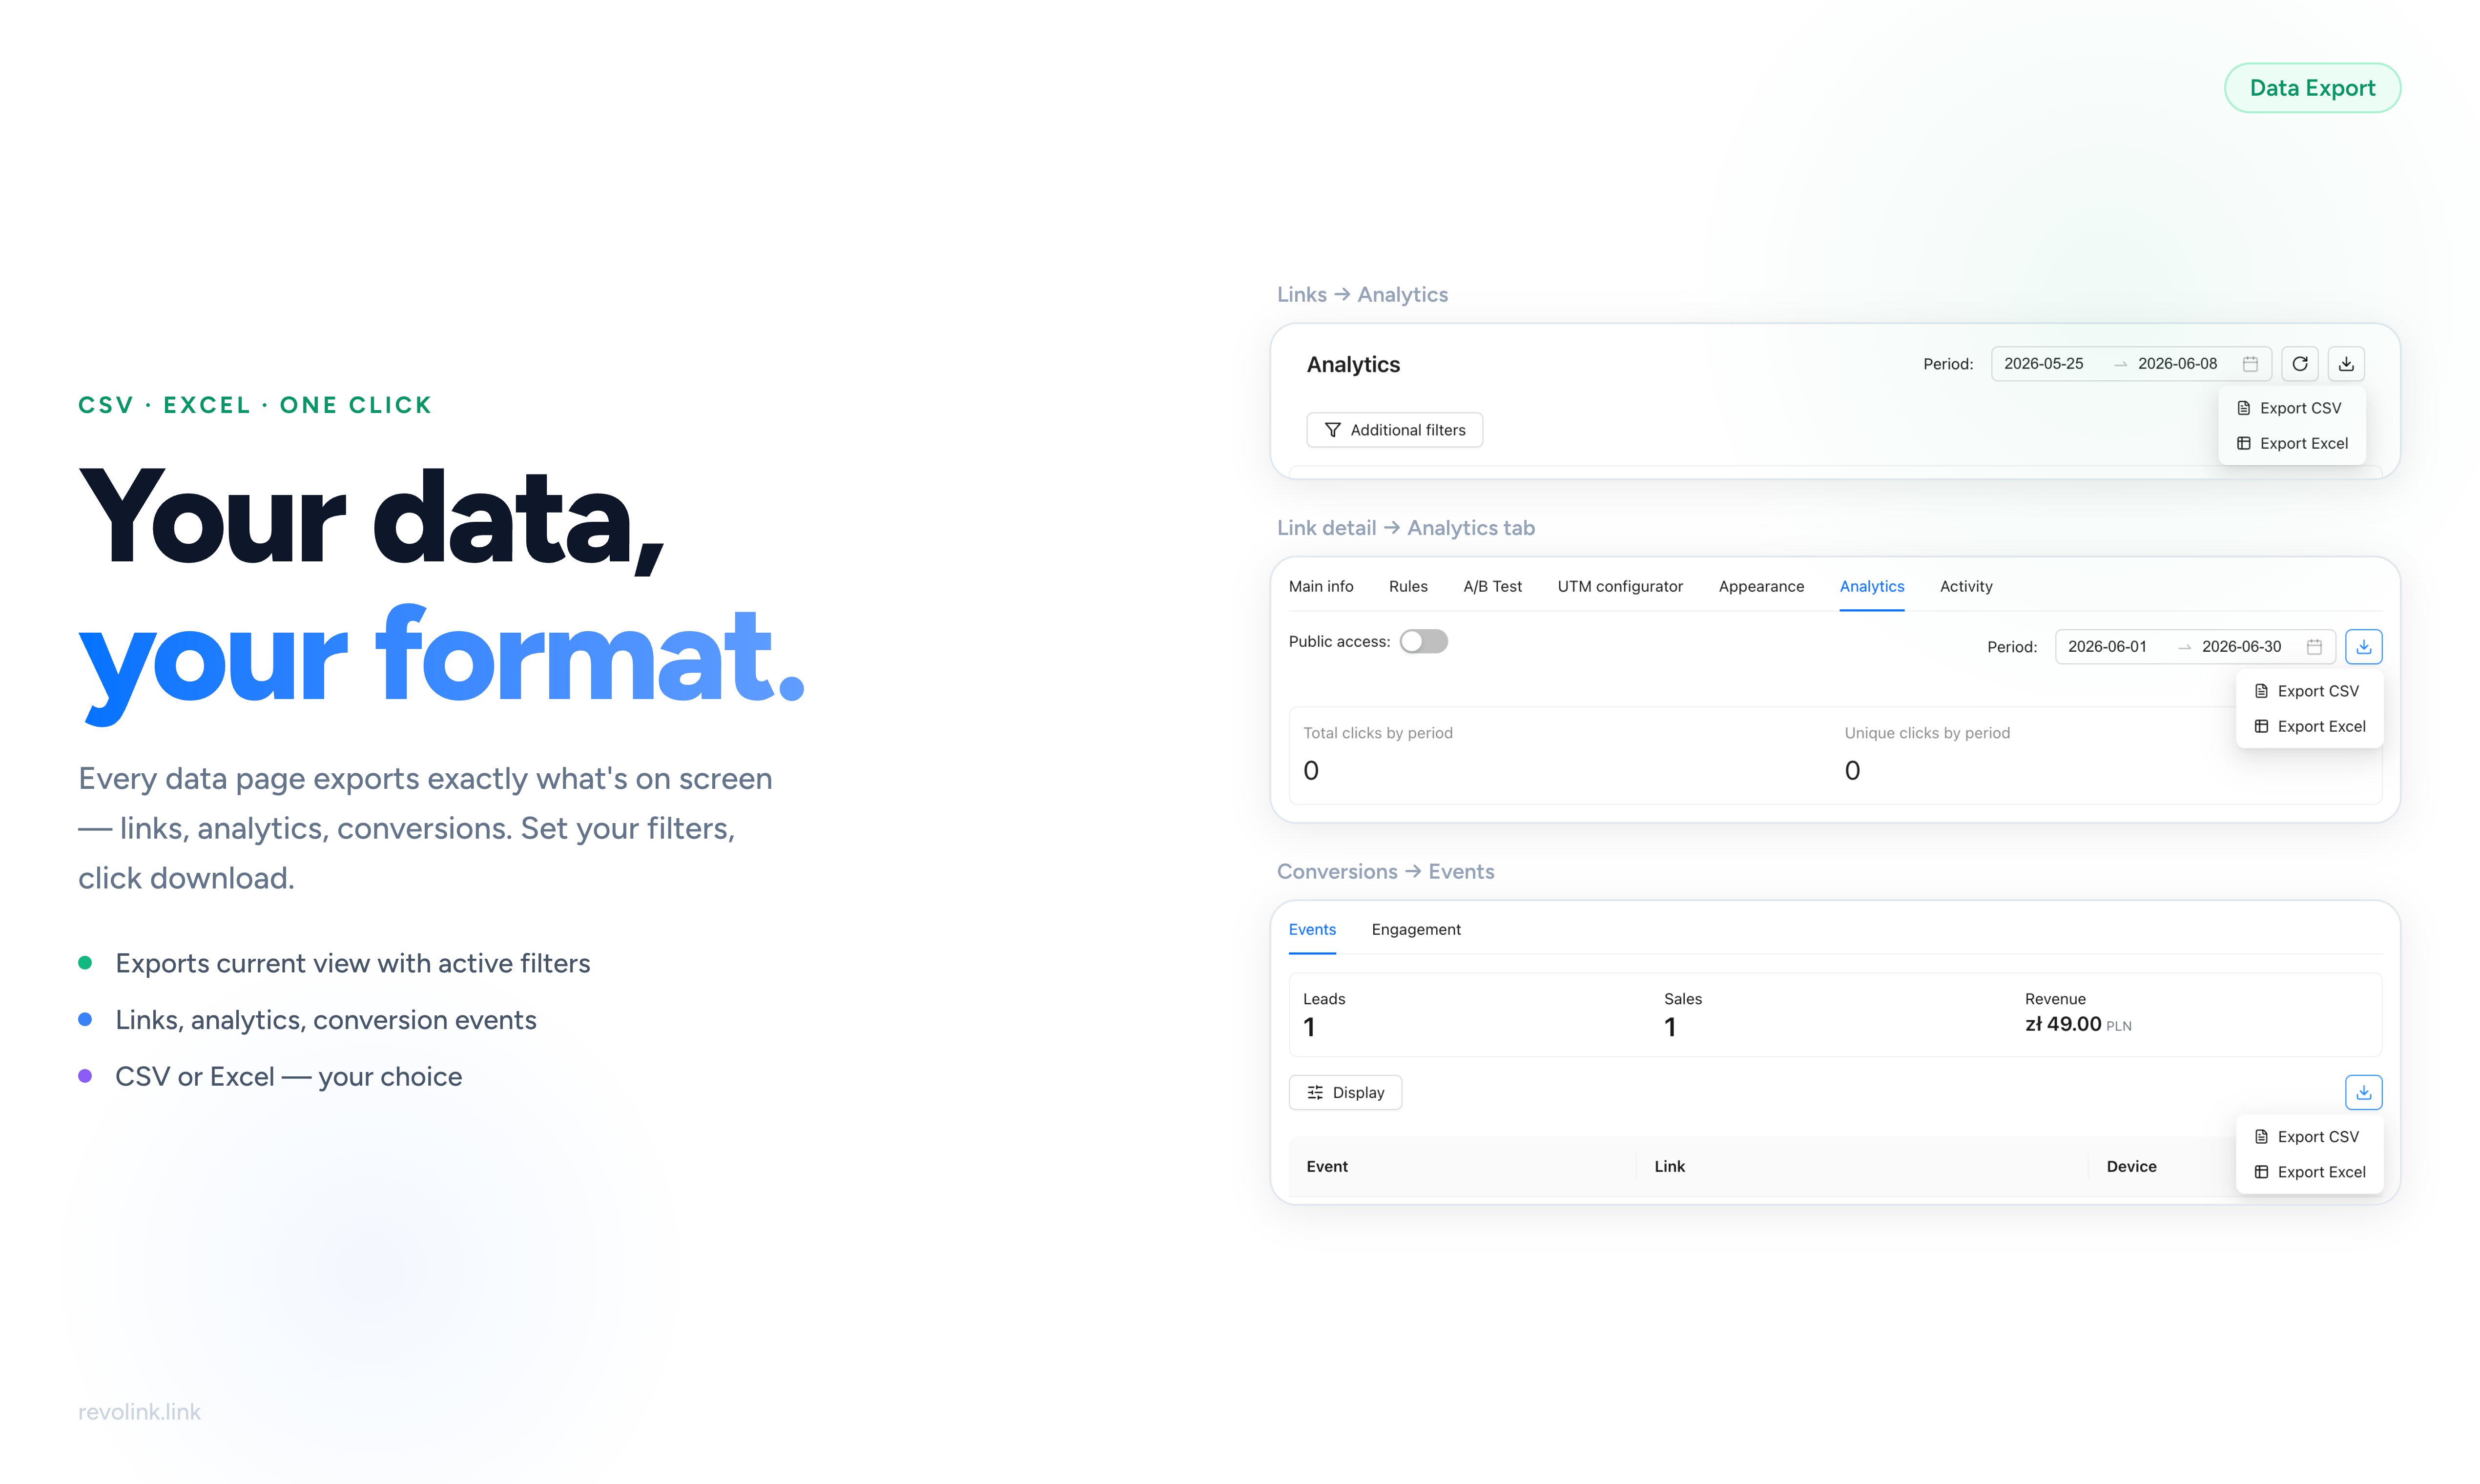
Every data page in Revolink now has a download button. Click it, pick CSV or Excel, and you get the exact data you're looking at - filtered, dated, and ready to open in any tool that works with spreadsheets.
No separate export screen. No configuration modal. No waiting for an email with a download link. Set your filters, click download, done.
How Export Works
The download button sits in the top-right corner of every analytics and conversion page. Click it to open a dropdown with two options: Export CSV and Export Excel.
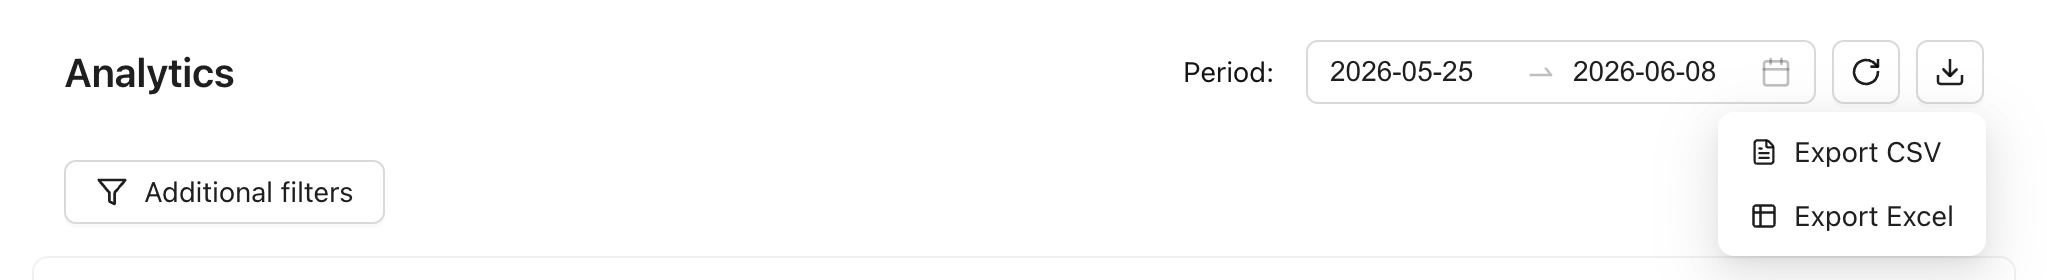
The export always reflects exactly what's on screen - including any date range, filters, or search terms you've applied. If you've set the period to a specific campaign window, the export covers only that window. If you've filtered by a tag or a specific metric, that filter carries through to the file.
Choose between:
- CSV - universal format, opens in Excel, Google Sheets, Numbers, R, Python pandas, or any BI tool. Best for data pipelines and programmatic processing.
- Excel (.xlsx) - formatted workbook, ready to open in Microsoft Excel or Google Sheets with column widths and headers preserved. Best for reports you'll share with stakeholders who open files directly.
Both formats contain identical data - the only difference is the file type.
Exporting Link Analytics
On any link's detail page, go to the Analytics tab. You'll find the same download button in the top-right corner, letting you export analytics for that specific link only.
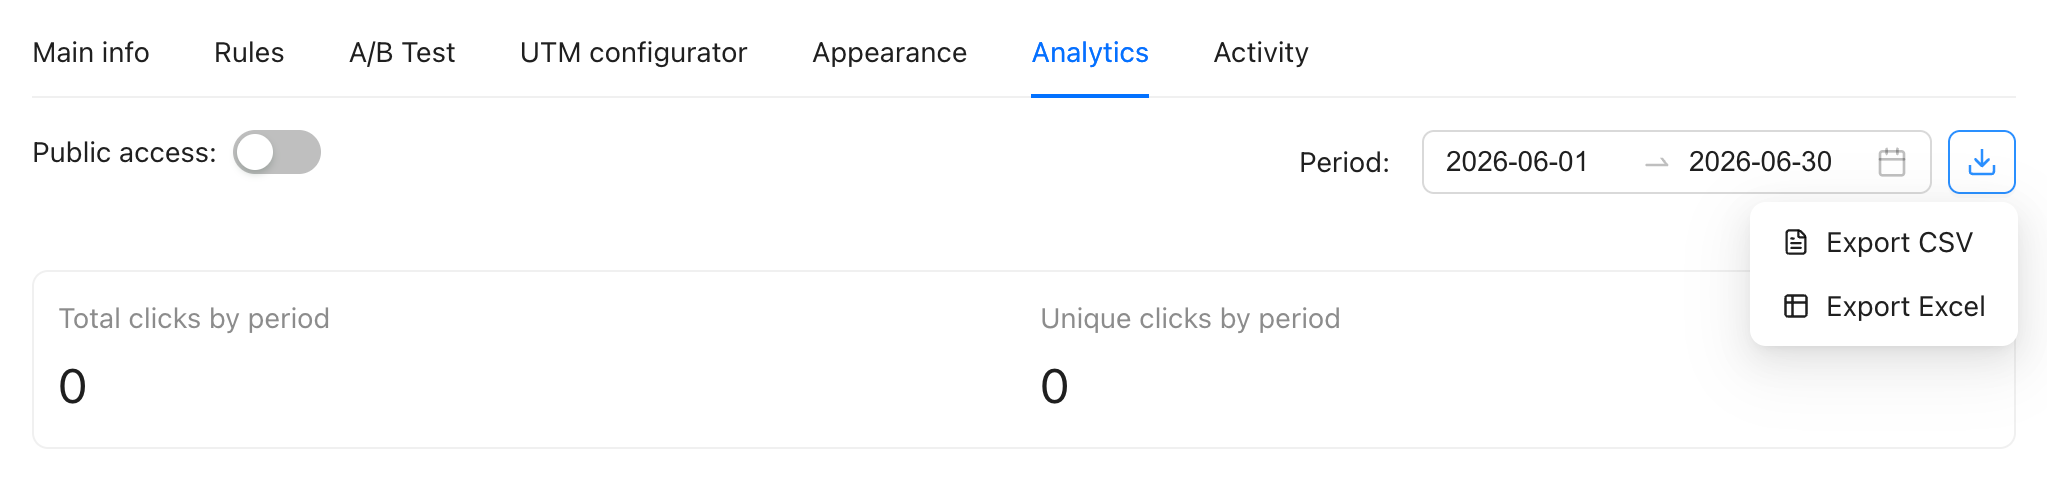
This export covers analytics for that one link - total clicks, unique clicks, and the breakdown by day, country, device, browser, operating system, and referrer - for the period shown on screen.
This is the export to use when:
- A client asks for performance data on a specific campaign link
- You want to compare how one link performed across two time periods
- You're handing off a link to another team and want to attach its historical data
Set the date range to match your campaign period before downloading, and the file will contain exactly the window that's relevant - no extra rows to trim.
Exporting Conversion Data
The Conversions section has its own export, and it's where the most valuable business data lives.
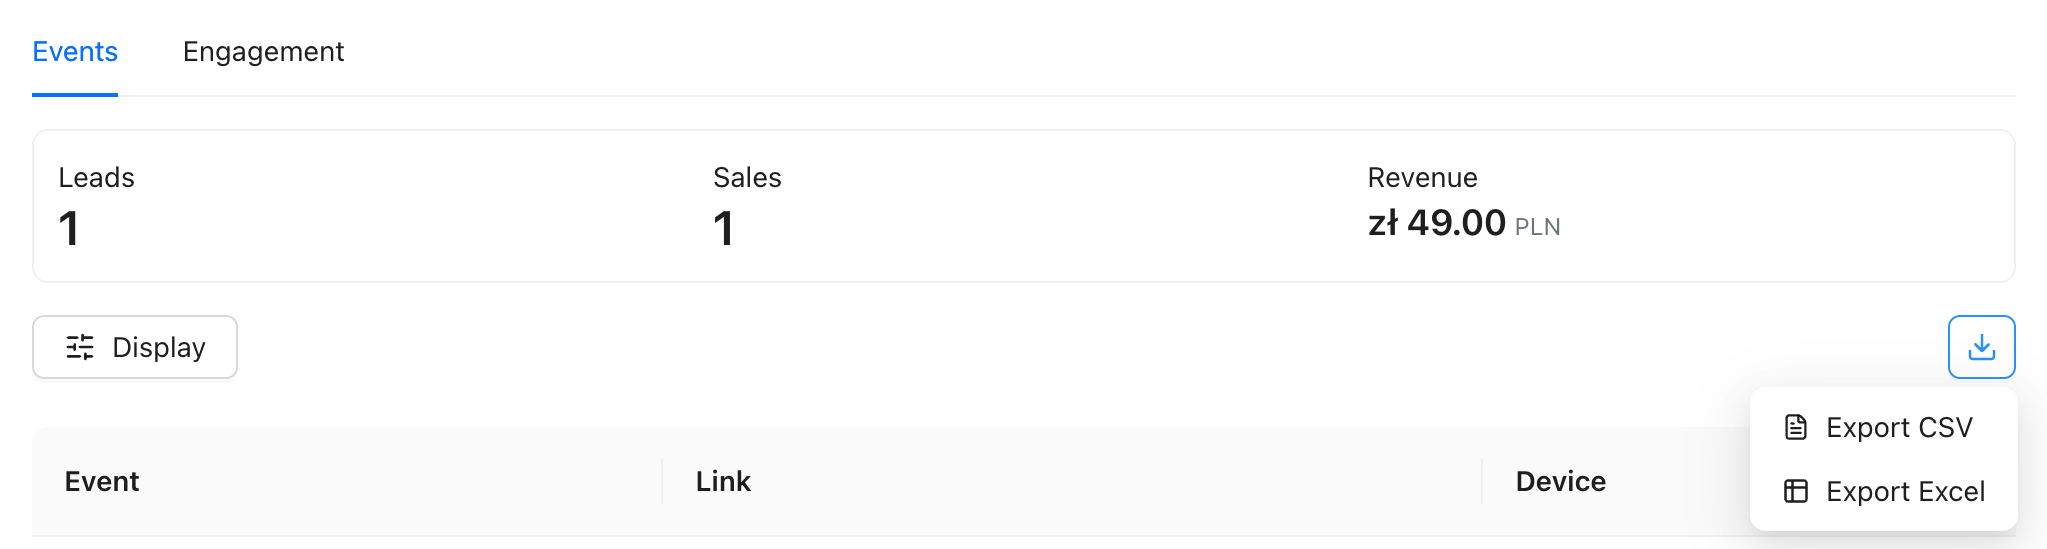
The Conversions page has two tabs, each with its own export:
Events tab - a row-level log of every tracked conversion event. Each row is one event: the link that triggered it, the event name (Lead, Sale, Purchase, etc.), the value attached to the event, timestamp, country, device type, and referrer. This is the raw event data - every individual conversion, one per row.
Use this export to:
- Calculate total revenue attributed to a campaign: filter for your purchase event, export, sum the value column
- Identify which links drove the most leads: group by link slug in your spreadsheet
- Build a per-event attribution report for stakeholders
- Feed conversion data into your CRM or data warehouse
Engagement tab - aggregated data grouped by day and link. Clicks and conversion rates side by side, over time. Less granular than the Events export, but easier to read as a summary and better for trend analysis.
What's in the Export Files
The exports are designed to be complete - no hidden columns, no pagination limits, no data that's visible in the dashboard but missing from the file.
Link analytics export includes:
- Date, total clicks, unique clicks
- Breakdown by country, city, device type, browser, OS, referrer
- Browser language breakdown (useful for multilingual campaigns)
- UTM parameters if you've used the UTM configurator
Conversion events export includes:
- Event name and type
- Link slug and destination
- Event value and currency
- Timestamp (with timezone)
- Country, device, browser, referrer
Engagement export includes:
- Date, link slug, total clicks
- Conversion count and conversion rate by day
Practical Use Cases
Monthly client report - set the date range to the calendar month on the Analytics page, export to Excel, add your branding, and send. The file already has the structure most clients expect.
Revenue analysis by campaign - go to Conversions → Events, filter for your purchase or sale event, export to CSV, open in Google Sheets, sum the value column grouped by link slug. Total revenue per campaign link in minutes.
Archiving before link cleanup - before deleting old links from your workspace, export their analytics and conversions data. This gives you a permanent record outside Revolink that you can reference later without needing to keep the links active.
Feeding a BI dashboard - export CSV on a recurring basis and import it into Looker Studio, Tableau, or Power BI. Because the export always reflects the current date range filter, you can standardize on a weekly or monthly export window and automate the process.
Language market analysis - if you're running multilingual campaigns with language-based routing, the analytics export includes a browser language column. Export the data and group by language to see which language markets are driving the most clicks and conversions - then use that to decide where to invest more localization budget.
A/B test results documentation - after an A/B test concludes, export the analytics for each variant link and archive the results alongside the test hypothesis. Useful for building an internal knowledge base of what messaging has and hasn't worked.
Tips for Getting the Most Out of Exports
Always set your date range before exporting. The export mirrors exactly what you see on screen. An unfiltered export downloads everything - which may be more data than you need and slower to work with.
Use CSV for automation, Excel for sharing. If you're piping data into a script or BI tool, CSV is simpler and more portable. If you're sending the file to a colleague or client who will open it directly, Excel preserves formatting and is less likely to have encoding issues.
Combine with tags for segmented reports. If you use tags to organize links by campaign, client, or channel, filter by tag before exporting. Each export then represents a clean segment - one tag, one file, one clear story.
Frequently Asked Questions
Is there a limit on how many rows can be exported? No row limit. The export includes all data for the selected period and filters, regardless of volume.
Can I export data for multiple links at once? Yes - the workspace-level Analytics page exports data across all links. For per-link data, open each link individually and export from its Analytics tab.
Is there a rate limit on exports? Exports are rate-limited to one request per 15 seconds per workspace. If you click download too quickly after a previous export, wait a moment and retry.
Does the export include UTM parameters? Yes, if you've used the UTM configurator for a link, the UTM parameters are included in the analytics export.
Can I export historical data older than what's shown in the dashboard? The export covers the same data range available in the dashboard. Setting a custom date range gives you control over how far back the export reaches.
Related Topics:

Maksym Yaroshchuk
Founder & CEO at Revolink. Writes about link management, marketing automation, and growth strategies.